Research
My research focuses on visualization, data analytics, visual design, and computer graphics grounded in real-world challenges. Below is a sample of ongoing projects in my group. For more information or other projects, please contact me. A complete list of publications can be found here.
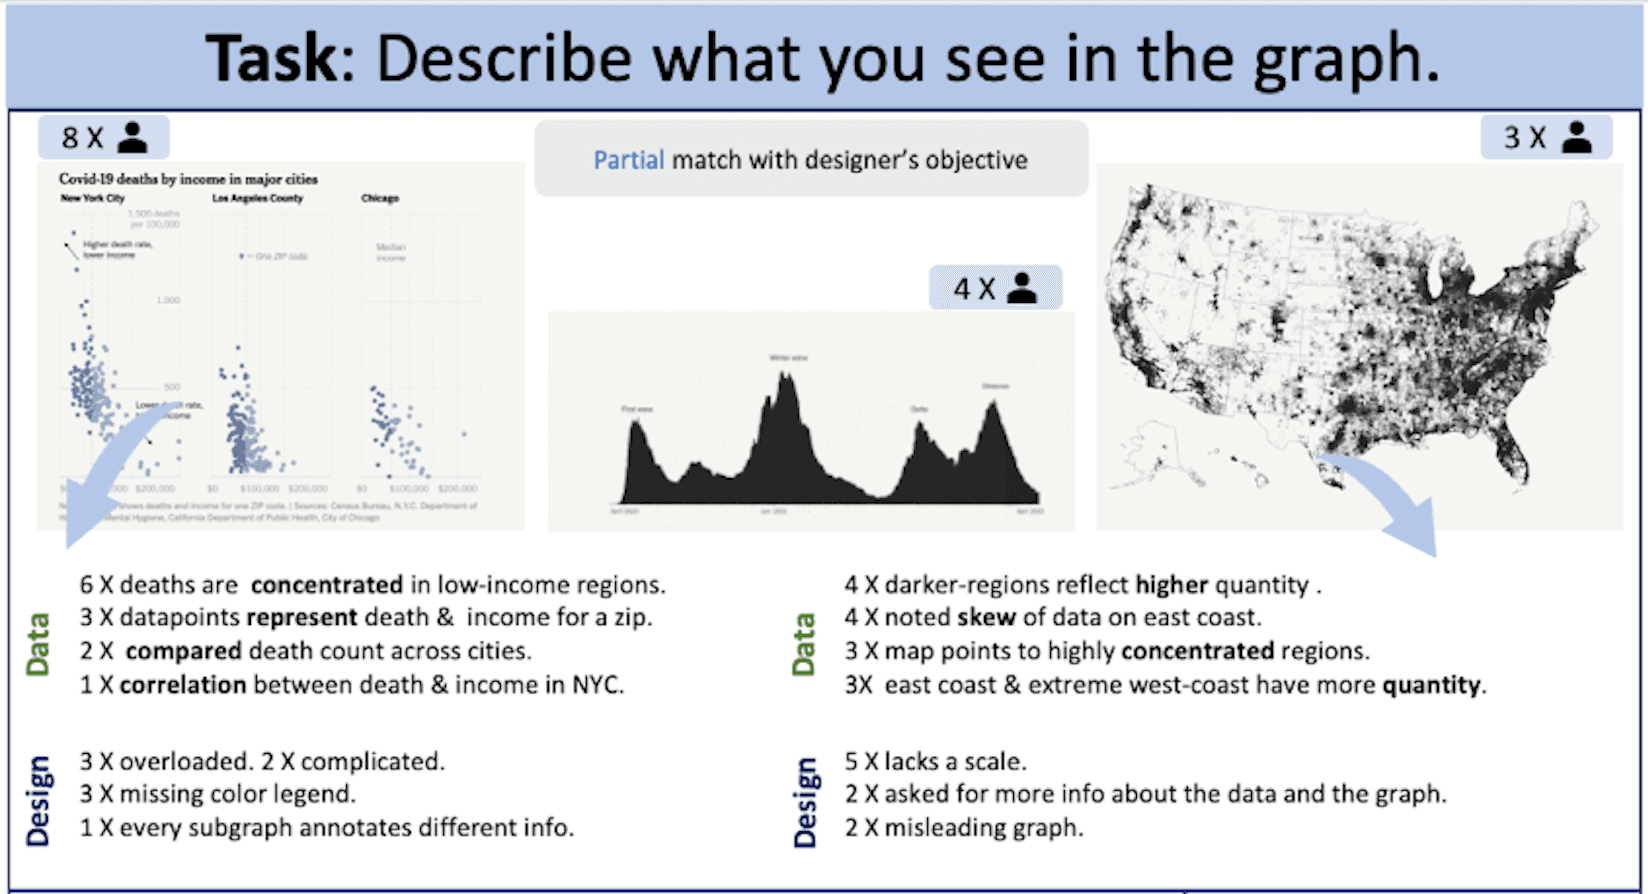
High Level Visualization Comprehension
High-level Visual comprehension describes the overall knowledge a viewer intuitively gains about the data without explicit cueing or guidance. Our work investigates the high-level patterns people naturally see when encountering a visualization without a guiding task. People's interpretations vary with both the features of the visualization itself and people's backgrounds, specifically their visual literacy, familiarity with graphs and data, and educational and professional backgrounds. Does comprehension reflect the salient statistics and patterns that emerge organically from a particular combination of data and design?
Related Papers
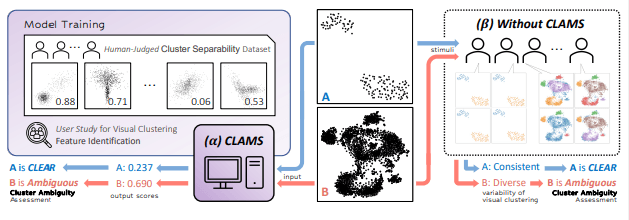
Quantifying and Modeling Perceptual Variability
How do we perceive complex visual information? Is this perception consistent across individuals? What factors shape these differences, and can we quantify them? To address the limitations of human visual perception in data visualization, computational metrics and models offer a path forward. By objectively measuring variability in interpretation (e.g., through cluster separability or other perceptual characteristics), researchers can systematically optimize visualizations for reliability and efficiency.
Related Papers
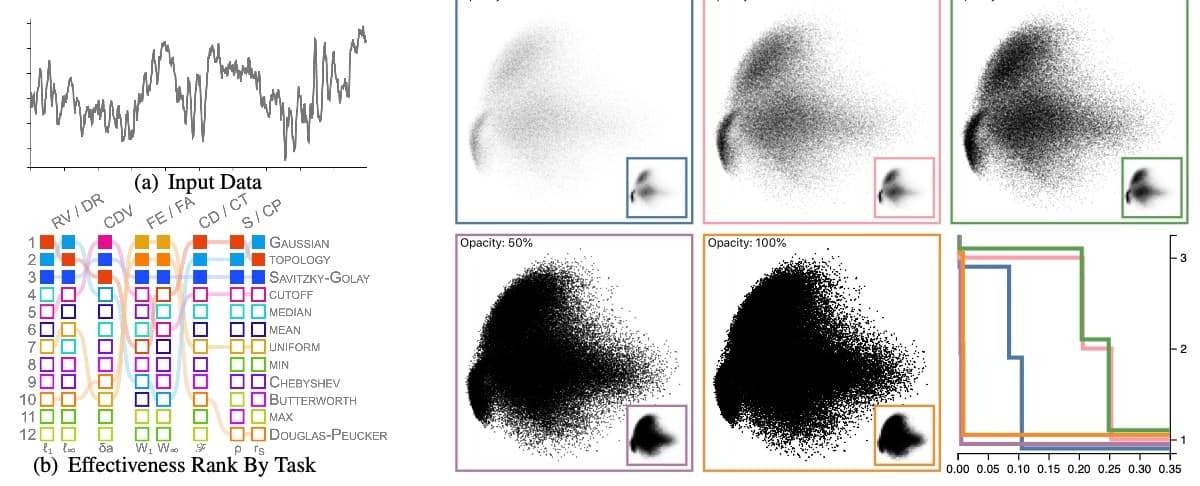
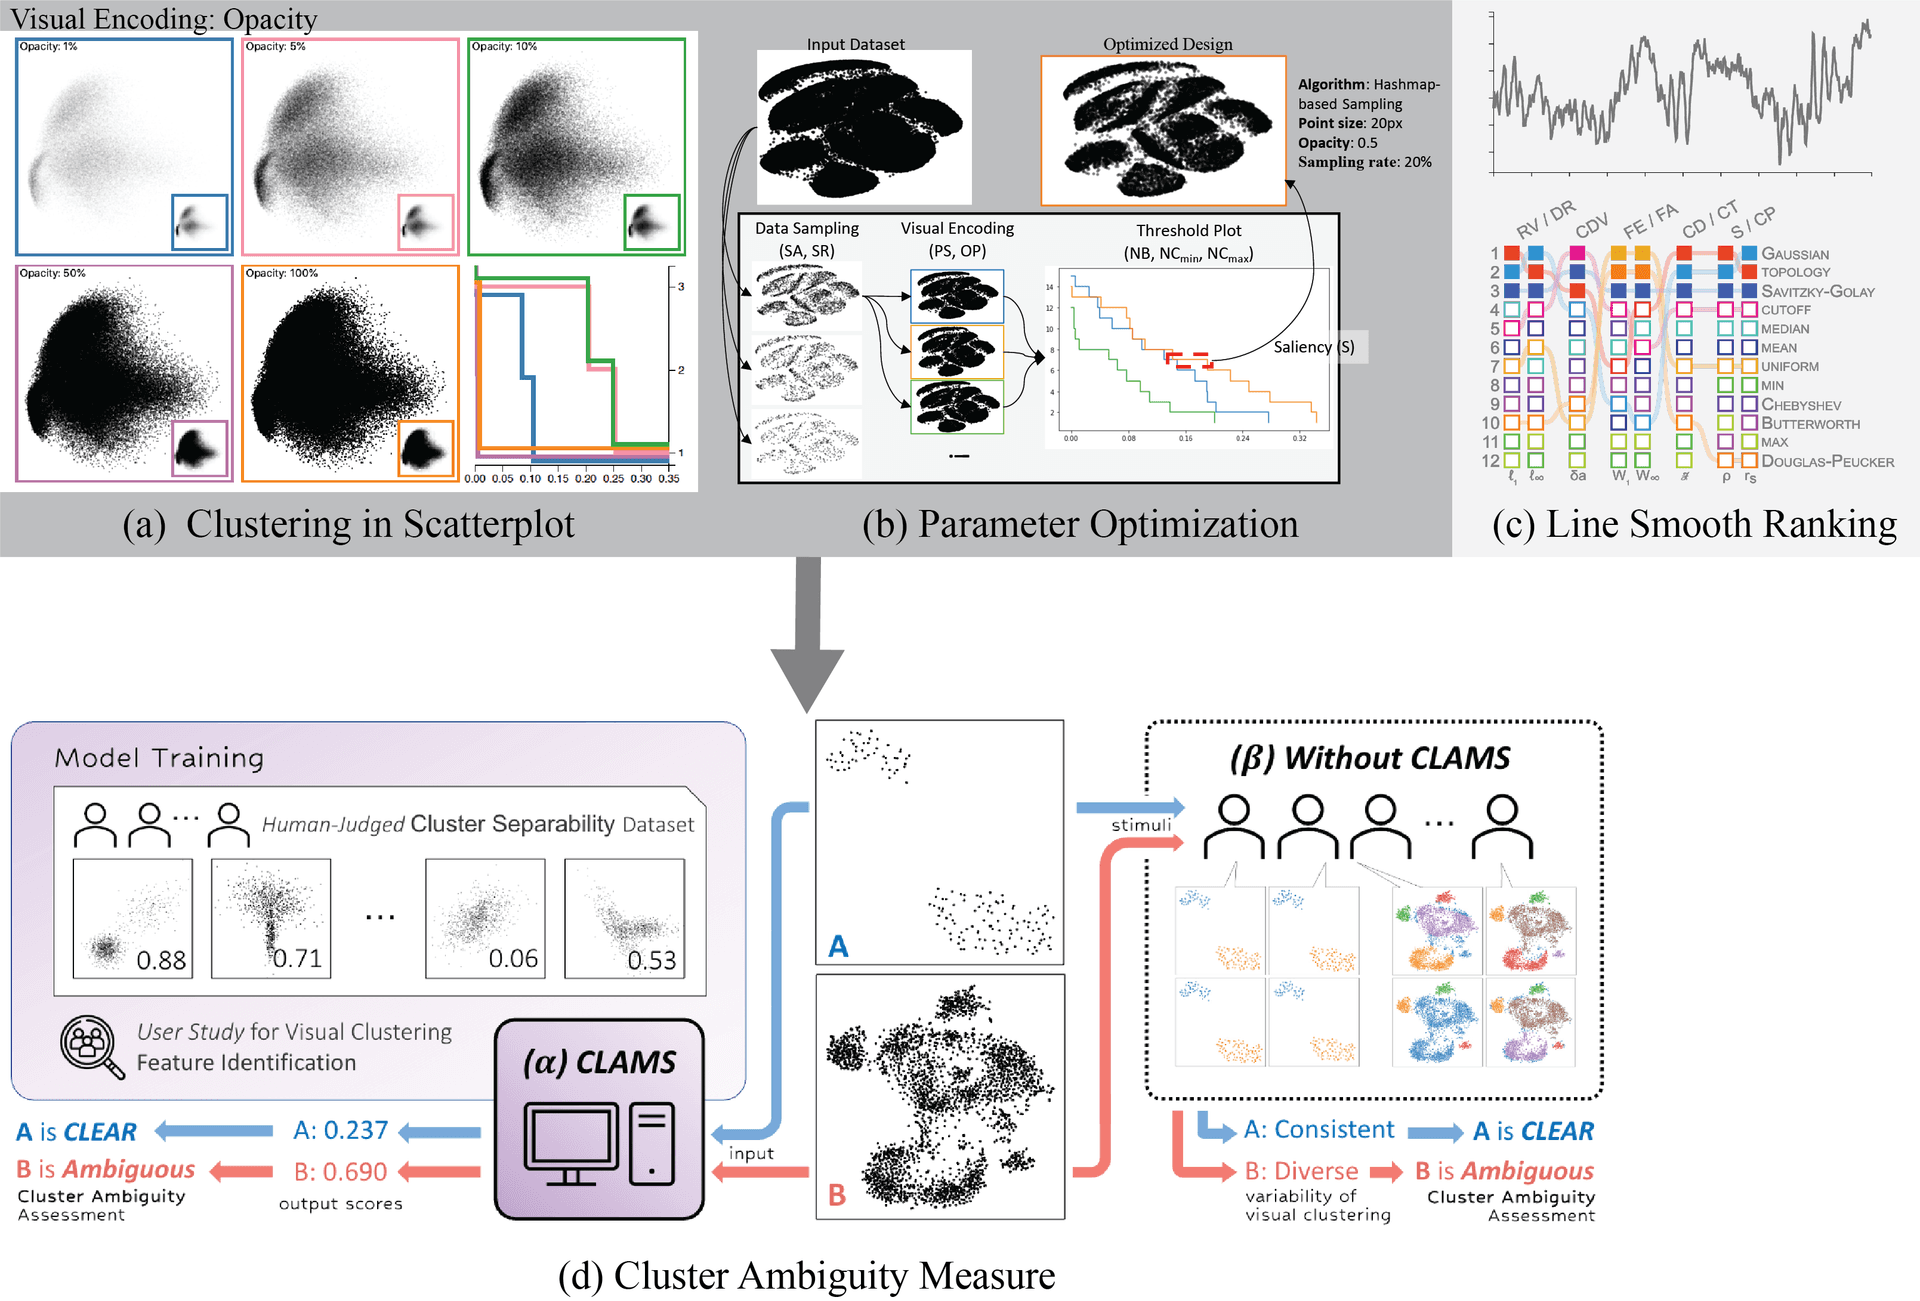
Design Optimization & Interactive Data Exploration
Our research focuses on optimizing visualization design to enhance user performance on specific analytical tasks, particularly for clustering and pattern identification across various visualization types. We develop frameworks for creating visualizations that are optimized for both tasks and design constraints, moving beyond one-size-fits-all approaches. Our work includes automatic optimization algorithms that determine ideal visualization configurations for identifying patterns in multivariate datasets, spanning from scatterplots to network diagrams, heatmaps, and other complex visual representations. These frameworks help balance competing design goals while providing interactive exploration capabilities that adapt to different analytical needs. By systematically approaching design optimization across the visualization spectrum, we enable more effective data communication and improve user performance in complex analytical scenarios.
Related Papers
Rethinking and Reviewing: A Conceptual Framework for Visualization Effectiveness
Most visualization designs and tools are built on decades-old studies and follow-ups but with limited scope. Further, we have progressed the visualization research significantly; however, we still need systematic review work to understand the progress of past studies through a taxonomy and solve the designers' and practitioners' design space problems using a framework. The curated understanding of progress guides us in advancing visualization as a research field. Systematic review provides a window into current knowledge and open research questions. How can we review findings and contextualize the results into taxonomies to understand the research developments and use them as guidance to improve visualization as a technique for data communication applications?
Related Papers
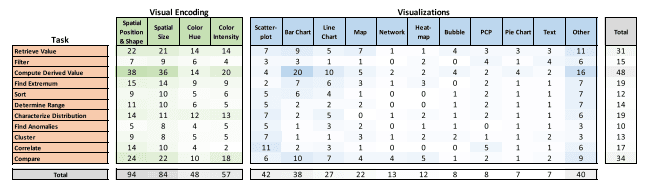
Constructing a Framework for Task-Optimized Visualization
An optimized visualization design renders a graph that would improve data communication and interpretation, leading to better decision-making. However, design guidelines focus on effective visualization design that depends on the visualization types, visual channels used, or specific visual tasks but independently, leading to a significant need to understand the intersection of these factors to create optimized visualizations. A design framework at the intersections of visual encoding and low-level tasks fills the gap between guidelines and application by providing a task-optimized visualization design incorporating optimized design choices supporting better performance at a given task. Our work expands on previous work by developing a framework that investigates the task effectiveness of visualization design as an ensemble of interdependent factors rather than visual elements. How can task-optimize a visualization to incorporate data clarity and allow people to extract salient patterns? How can we utilize these frameworks to provide less ambiguous data presentations, leading to better quality and higher confidence in decision-making? How can we automate visualization design optimization?